SIERA.AI Dashboard now offers insightful charts and trends of data in a more user-readable format

- A new section ‘Analytics’ will be present in the navigation menu on the left.
- There are two aspects of this section
- Charts Library
- Your Charts
What all has been offered in this Library of Charts
- On entering this section, you will be able to see a list of default charts
- All charts are broken down into 3 categories: Inspections, Impacts and Near-Misses
- You can now search for charts in this list, using the search bar above the list.
- There is a duration filter above the charts as well which allows you to filter the range of the charts from the Latest to All Time.
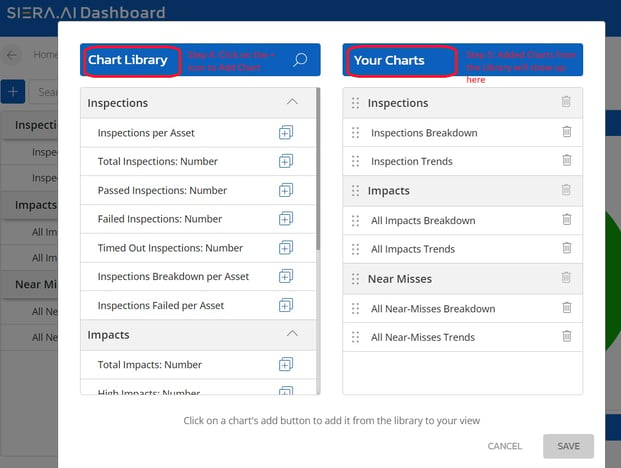
- You can also access the Charts Library provided by SIERA.AI. It can be accessed by clicking the ‘+’ button before the search bar.
- A new model opens up with two panels in it; Charts Library on the left and Your View on the right.
- The panel on the left contains ALL the charts that SIERA.AI offers to its customers.
- The panel on the right contains the charts that the user wants to see on their analytics page.
NOTE:
The users can also customize the order of the charts within each section.
- You can also customize the order of each section, depending on what you want to see first or later

- The user must click on the SAVE button to save their order/preferences changed here.
